
Repatriant Case Study
“Repatriant” demonstrates one of The Quiet Orbit’s core capabilities: building a client-owned marketing system around an expert service when almost none of the necessary infrastructure exists yet.
In two months, a name, rough calculations, and an AI-generated image became a bilingual website, Meta and Google advertising infrastructure, analytics, lead processing, and first-party market data. The project stopped before the funnel could be validated through signed contracts. The part we did validate shows how far TQO can move a business forward in its first two months.
A Foreword from the TQO Director
Bogdan, TQO Director

We took on this project in a tense and, in many ways, paradoxical historical context. After 24 February 2022 and everything that has unfolded since, the very idea of returning to Russia creates an almost automatic inner conflict for many people.
Demand from neighboring post-Soviet countries fits a more familiar pattern. People from Tajikistan, Uzbekistan, Armenia, Georgia, Kazakhstan, and other nearby countries have long maintained practical, cultural, or family ties to Russia. A shared language, personal connections, employment, and a familiar environment make this direction understandable. We had already worked with an immigration lawyer handling similar requests, so cases like these were expected.
Demand from people in Europe, the United States, and Canada was less obvious. I had already been living outside Russia for three years, and I could see people looking for ways to settle in Georgia—where I was living when this case study was written—and elsewhere. Questions about relocation, legal status, and building a new life kept returning in emigrant communities. A path in the opposite direction existed alongside them. Every person had their own circumstances, biography, limits, family values, personal economics, and relationship with their homeland.
Beyond politics, people still have roots, memories, language, relatives, a familiar cultural landscape, and a wish to restore a lost sense of continuity. For some, returning is a calculated decision. For others, it is a family story or an attempt to reconnect a broken thread.
This is especially visible among the 1.5 generation: people who left as children but retained memories of Russia, an interest in the country, and a sense that the connection remained unfinished. There is enough human truth in those motives to take them seriously.
Our task, therefore, was to respect each person’s reasons. In this niche, decisions are rarely casual. A long consideration cycle, the high cost of a mistake, and dense bureaucracy force people to weigh every step. Impulse and polished advertising have limited power here. A qualified lead already has a serious reason to look for a route home, and that became an important ethical foundation for the project.
Our values place our clients’ customers and their needs at the center of the work. When we help a business grow, we are ultimately working with the real demand, desires, and life tasks of the people who turn to that business.
Seen from this perspective, the question “Why take on this project?” loses its artificial drama. The decision to return belongs to the individual. Our work helps that person find a path back to familiar places, their language, people close to them, and their own biography.
There is a clear human logic in that desire. We care about people and our homeland, and we view the state as a separate political reality. A person who genuinely wants to return deserves help navigating that path consciously and step by step.
About the Project
“Repatriant” operated in the legal and immigration sector. The client described the service as consulting: her team helped compatriots restore or obtain Russian citizenship, explained the procedure, and guided clients through the legal process. Representation before government authorities was outside the scope of the service.
The client already had subject-matter expertise, experience working with people, and the ability to guide clients through the process.
Almost all the infrastructure required to take the service to market was missing at the outset: a finished website or landing page, formalized unit economics, a documented conversion funnel, a validated advertising channel, stable analytics, and a coherent brand presentation.
Oleg Tinkov says “Ni-hu-ya,” which means “absolutely nothing,” in an interview with Yuri Dud.

The available brand assets amounted to the direct name “Repatriant” and an image generated in an online service to serve as a logo. Everything else consisted of the client’s experience and rough calculations.
In blunt terms, the starting kit was extremely short: expertise, a name, rough calculations—and virtually nothing else.
This starting point demonstrates TQO’s ability to build from a minimal set of assets and connect the resulting infrastructure into a system that remains with the client.
From a Starting Point to a Working System
| At the outset | By 23 January 2026 |
|---|---|
| The client’s expertise, a name, and rough calculations | A Road Map, media plan, Buyer’s Journey, unit model, and hypothesis system |
| An AI-generated image serving as a logo | A visual system and a bilingual WordPress website for desktop and mobile |
| No website, social media presence, or advertising infrastructure | Working Meta and Google Ads setups, including a route to launch through partner access while the ad account was restricted |
| No analytics infrastructure | GA4, GTM, a dataLayer, and events spanning section views through form submissions |
| No system for processing demand | Meta Lead Forms, website forms, Google Sheets, and lead qualification |
| Assumptions about acquisition costs | First real-world benchmarks for CPL and cost per qualified lead |
| An almost empty marketing environment | Hosting, repository, codebase, data, and access held on the client’s side |
Objective
The client came to us with her own preliminary model. In her logic, the project needed to reach approximately 8–12+ signed contracts. She estimated that this would require around 80 qualified leads, generated from approximately 400 initial inquiries. A qualified lead was defined as someone who agreed to a call.
This framework was important as a starting point. It showed the sales volume the client considered desirable, the number of calls the system would need to generate, and the amount of inbound demand that might be required to reach signed contracts.
| Client’s preliminary model | Value |
|---|---|
| Target number of signed contracts | 8–12+ |
| Qualified leads | approximately 80 |
| Initial inquiries | approximately 400 |
| Lead qualification criterion | agreement to a call |
| Average client value | approximately RUB 100,000 |
We then built our own unit model to test the economics of paid acquisition. The calculation tracked the fee, advertising budget, and average operating expenses separately. Advertising budget divided by CPC produced the number of clicks. After accounting for a 30% bounce rate, 20% of the remaining clicks were expected to convert into leads, and 10% of those leads into clients. CPL was calculated from advertising spend alone, while CAC included both advertising spend and the agency fee.
| TQO unit model | Low CPC | Average CPC | High CPC |
|---|---|---|---|
| Agency fee | $1,251.00 | $1,251.00 | $1,251.00 |
| Advertising budget | $1,251.00 | $1,251.00 | $1,251.00 |
| Average operating expenses | $433.33 | $433.33 | $433.33 |
| Cost per click | $1.50 | $2.50 | $4.50 |
| Bounce rate | 30% | 30% | 30% |
| Conversion of non-bounced clicks to leads | 20% | 20% | 20% |
| Lead-to-sale conversion | 10% | 10% | 10% |
| Average client value | $1,300.00 | $1,300.00 | $1,300.00 |
| Number of leads | 116.76 | 70.06 | 38.92 |
| Number of clients | 11.68 | 7.01 | 3.89 |
| CPL | $10.71 | $17.86 | $32.14 |
| CAC | $214.29 | $357.14 | $642.86 |
| Revenue | $15,178.80 | $9,107.28 | $5,059.60 |
| Gross profit before tax | $12,243.47 | $6,171.95 | $2,124.27 |
At the outset, we used this model as a rough benchmark. In terms of client numbers, the average scenario at a $2.50 CPC produced 7.01 clients, slightly below the client’s lower target. The low-CPC scenario produced 11.68 clients and the high-CPC scenario 3.89.
A direct comparison between the two models would have been methodologically unsound. Galina’s preliminary model separated 400 initial inquiries → 80 qualified leads → 8–12+ signed contracts. Our model had no separate qualification stage between an initial lead and a client, so the average scenario’s 70.06 leads could not be treated as equivalent to Galina’s 80 qualified leads.
The first advertising launches exposed the difference between a form submission and a qualified inquiry. For that reason, the final case study calculates the cost of initial and qualified leads separately.
The first stage aimed to test the market’s actual economics: CPC, lead conversion, inquiry quality, and the funnel’s ability to move a person from first contact to a call and then to a signed contract.
One further caveat matters: the client did not explain the source of her preliminary model. We assume it may have reflected experience from a previous role in a similar field. The budgets used to support that model, if any, are unknown.
Timeline and Budget
The project began on 24 November 2025. The client stopped the engagement on 23 January 2026, so this case study covers a working period of approximately two months: assembling the project foundation, testing advertising economics, and collecting the first demand data.
Screenshot from the close of the engagement on 23 January 2026

Our initial commercial proposal assumed an accelerated route to the first advertising launches. The benchmark for Google Ads was 16–24 days. For Google + Meta, it was 23–35 days, depending on preparation complexity, account condition, analytics, the landing page, and ad review.
| Estimate in the initial proposal | Timeline |
|---|---|
| Media plan | 7 days |
| Landing page brief and concept | 2 days |
| Design and development | 7–12 days |
| US/CA/EU policies and compliance | 3 days, in parallel with development |
| Analytics integrations | 1–7 days, up to 14 for Facebook |
| Meta setup and launch | 7–14 days |
| Google Ads launch | 16–24 days |
| Google + Meta launch | 23–35 days |
In retrospect, these timelines were optimistic. The margin we allowed for delays did not cover how little existed at the outset and how many hidden dependencies the project contained. Those dependencies had to be resolved before a proper advertising launch.
The client also expected a fast launch. Her preliminary economic model assumed an ambitious volume of leads and signed contracts within the first stage. It may have reflected experience from a previous role in a similar field, where infrastructure, data, recognition, established processes, or larger budgets were already in place. This project began close to zero, immediately changing the pace of the work.
The initial advertising budget under discussion was RUB 100,000, approximately 1, 300 * * intheproject′sworkingcalculations.TheTQOunitmodelusedasimilaradvertisingbudgetof * *1,251.00.
The test budget was tied to specific expectations. The client wanted to see initial inquiries and practical evidence that the project could move forward. For us, the budget needed to produce the first real market signal: CPC, CPL, inquiry quality, audience response, and the actual pace at which the funnel could be assembled.
The initial framework was designed for a fast test. The project’s actual condition required more preparatory work than the optimistic scenario allowed for. The gap between the expected pace and the state of the source assets became an important factor in everything that followed.
Preparation and Project Kickoff
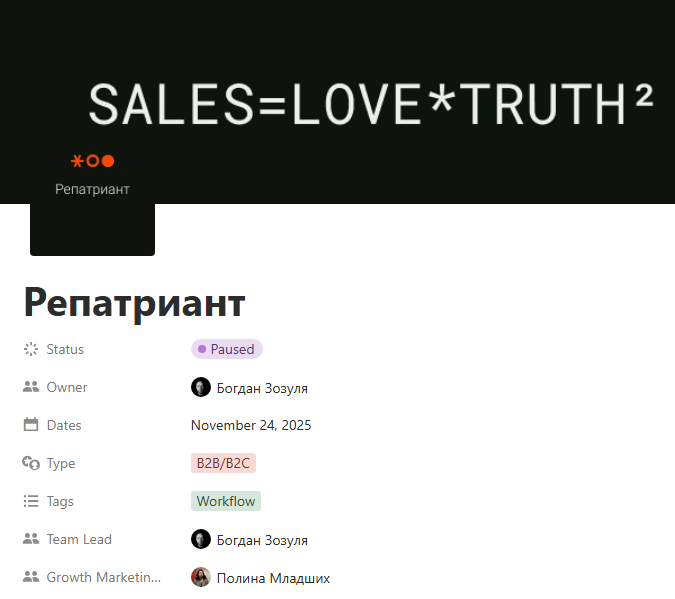
As part of TQO’s standard operating discipline, we created a dedicated Workflow page in Notion and gave the client access by link. It became the project’s operating environment, bringing together reports, tasks, results and conclusions, the media plan, the Buyer’s Journey, hypotheses, website decisions, and infrastructure notes.
The “Repatriant” Workflow page in Notion
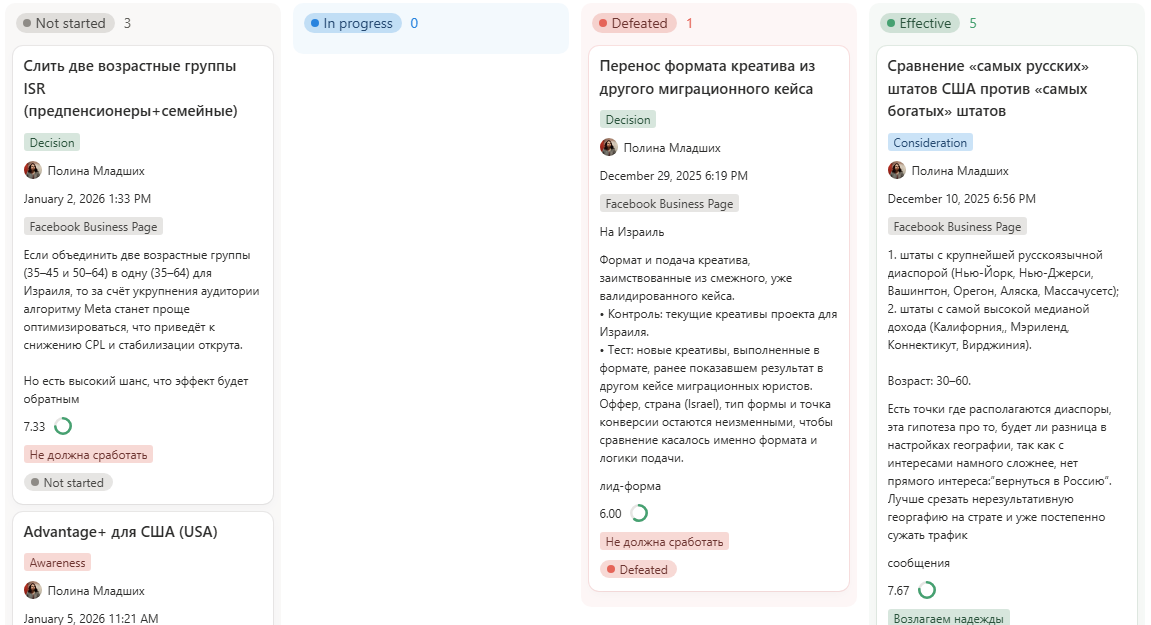
We then began building the media plan as the foundation for both the website and advertising. The logic was practical: the website had to support the specific hypotheses and combinations we planned to test across the United States, Canada, and Europe. Before development began, we needed to understand which audiences would enter the project, what might motivate them, and which messages could move them toward an inquiry.
Media plan: hypotheses and audiences
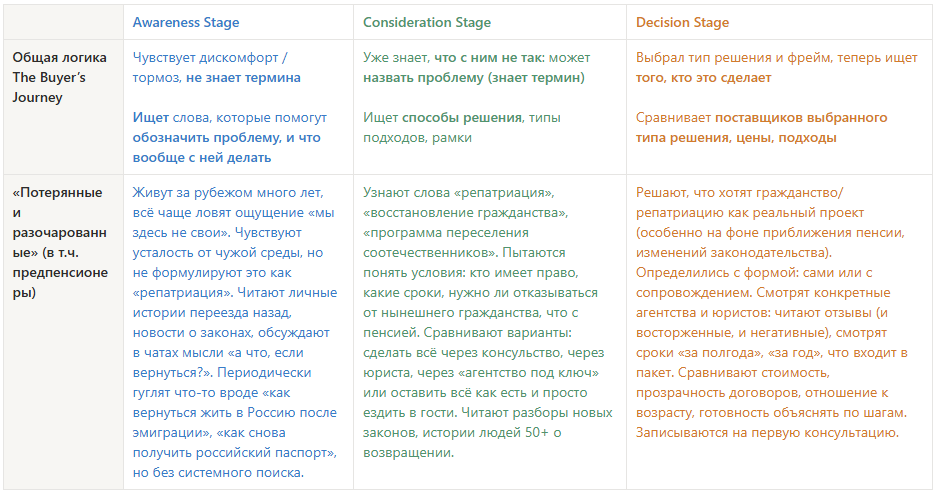
In the Buyer’s Journey, we mapped the audience by scenario and expanded it beyond the formula “Russian speakers living abroad.” The website brief already contained distinct motivational entry points: people who had lived abroad for years without ever feeling fully at home; families considering their children’s future; entrepreneurs who needed citizenship for travel, assets, and property; and people tired of instability who were looking for a clear path home.
Buyer’s Journey and audience segments
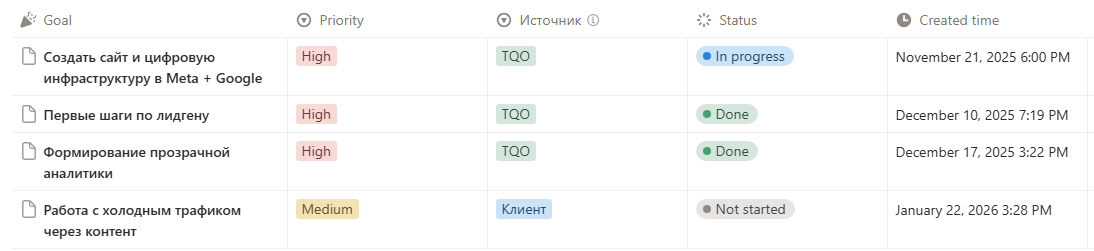
The project Road Map became a separate working artifact. It divided the project into phases: market entry, infrastructure development, initial lead and data collection, hypothesis development, and the transition toward a metastable funnel. This management map defined what the system needed to contain before the project could gradually move from assumptions to first-party data.
“Repatriant” Road Map
After the media plan, we prepared the website brief. Its first version included a hero section with a consultation as the primary action, a section covering recognizable audience situations, an expertise section, an explanation of the consultation’s value, a process road map, an FAQ, a blog, contact details, and a legal disclaimer. Each section had a distinct function: give visitors language for their situation, show the route ahead, reduce some of the anxiety, explain the scope of the service, and lead them toward an inquiry.
“Repatriant” website brief

During preparation, we reconsidered the platform. Tilda was the original option. An analysis of competitors and the technology used by similar projects shifted the decision toward WordPress. Across five competitors, three used WordPress, one used either a MODX-class CMS or a static build, and one used Tilda. For “Repatriant,” it made sense to choose a foundation that could support articles, FAQs, service pages, legal explanations, and long-term SEO growth.
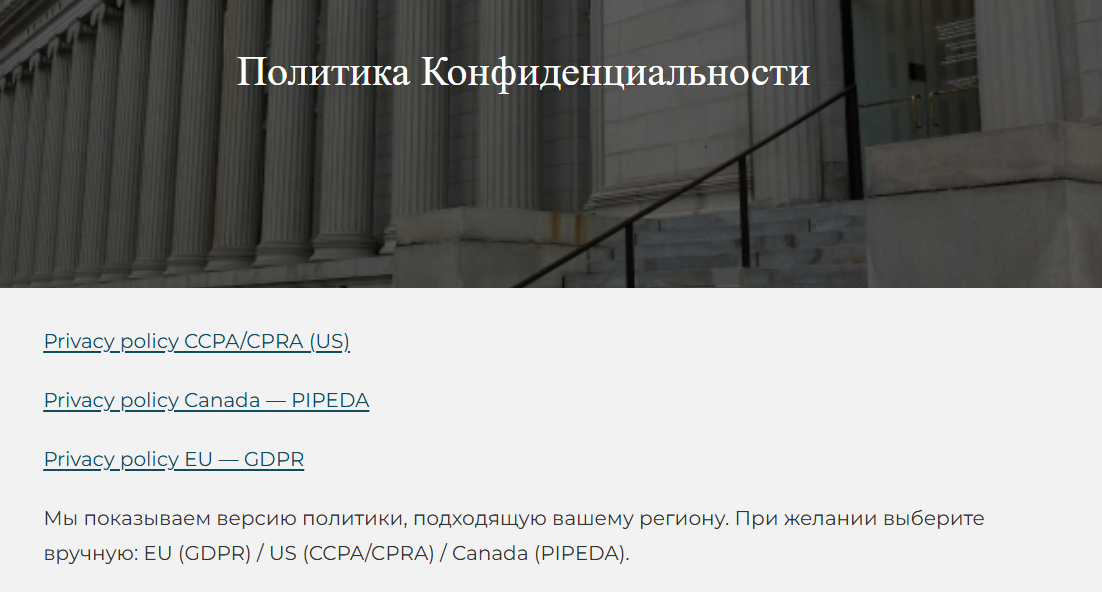
In parallel, we began assembling the website’s legal and technical layer. An audience spanning the United States, Canada, and Europe required different privacy policies and disclaimers: CCPA/CPRA, PIPEDA, and GDPR. These requirements affected the form structure, page copy, data collection, and future ad review.
US/CA/EU privacy policy section, as implemented in the final website
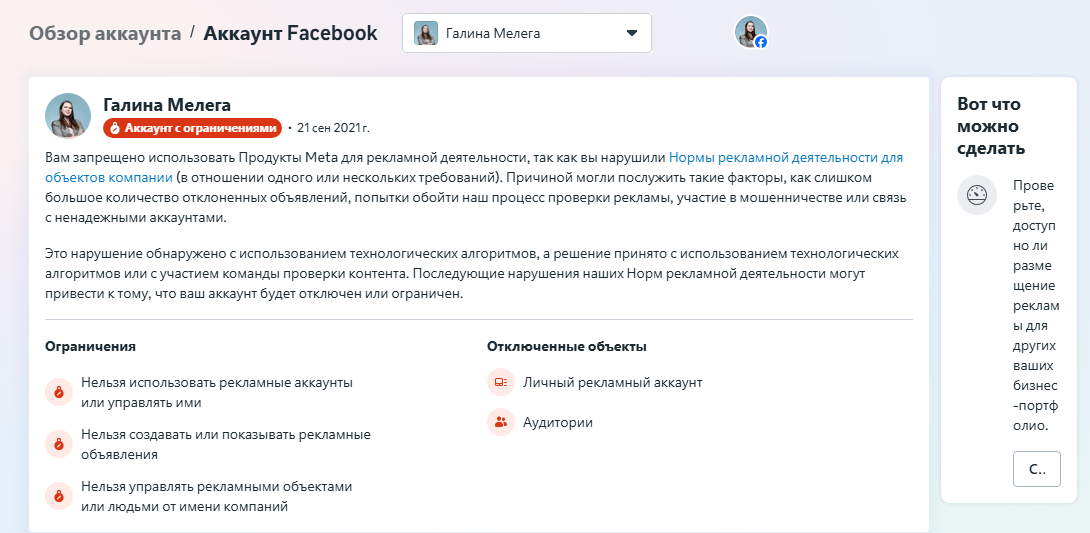
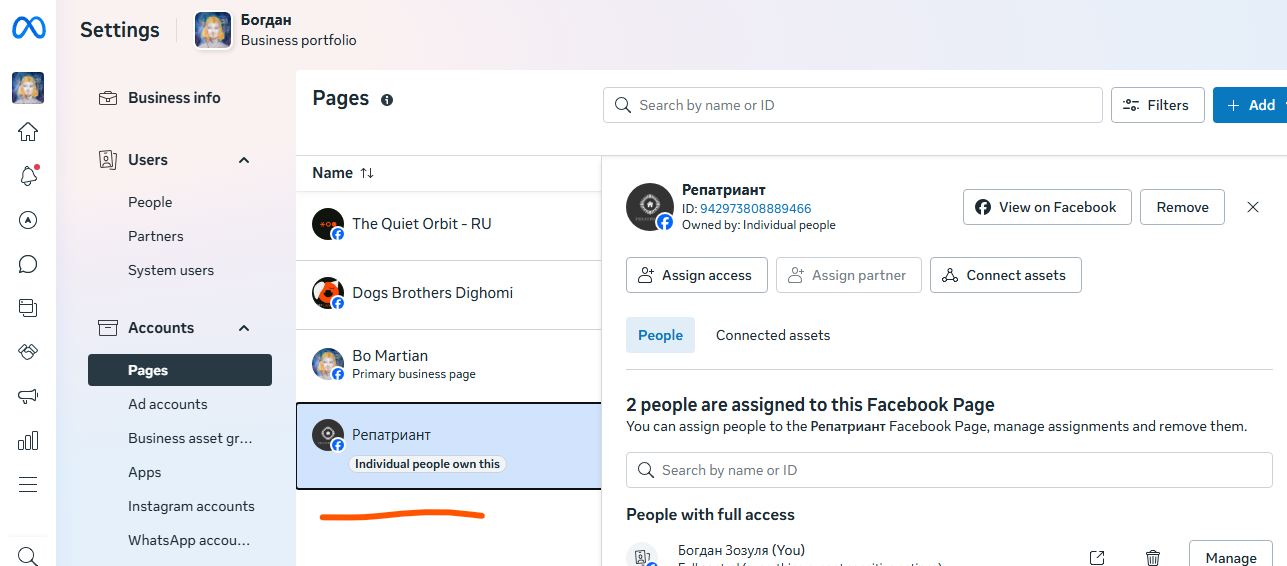
Advertising infrastructure entered preparation immediately as well. We created a “Repatriant” Facebook Page and Instagram account, connected them, and attempted to add them to the client’s business portfolio. At this point, we discovered a full advertising restriction on her personal profile dating back to 2021. The standard route through her Business Portfolio was unavailable, so we had to build a launch path through partner access to the Page.
Meta infrastructure report: Account Quality and advertising restriction
Partner access used for the alternative launch setup
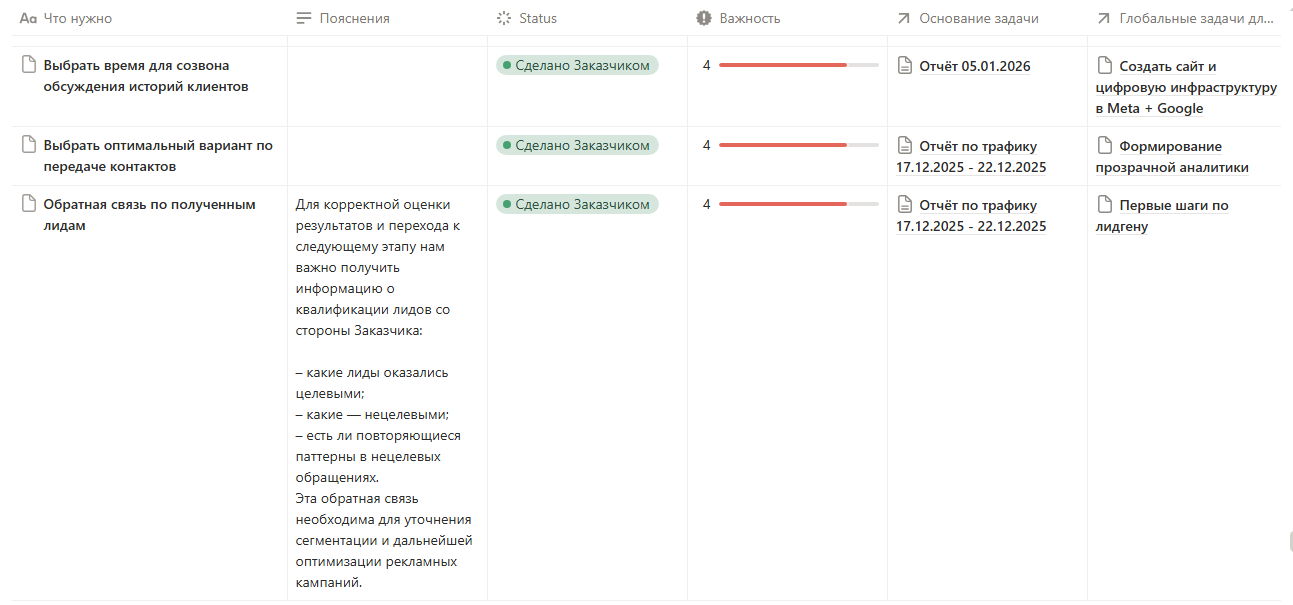
The client’s preparatory responsibilities were also documented: log in to the old Facebook account and complete the available recovery steps, provide service materials, clarify website information, approve the structure, and supply data for legal and contact sections. We placed these items in the shared workspace with a clear division of responsibility between TQO and the client.
Client-side task list
Execution
1. The Website as the Project’s Production Hub
The website was the first major decision point. In the original commercial logic, a fast Tilda landing page was a reasonable option: we could build the page, connect forms, add analytics, and move the project toward traffic sooner. A closer analysis of the niche led us to reconsider that choice.
We examined the technology used by similar projects and competitors. The client’s former employers used WordPress. Of the five projects selected for comparison, three used WordPress, one used either a MODX-class CMS or a static library, and one used Tilda. This was a meaningful signal in the legal and immigration niche: strong operators preserve architectural freedom for SEO, articles, FAQs, service pages, legal explanations, and future website development.
The “Repatriant” website began to take shape as the foundation of the future funnel. It needed to explain the service, sustain trust, receive advertising traffic, collect inquiries, connect to analytics, and eventually grow into a content base. WordPress offered the more durable foundation for this path.
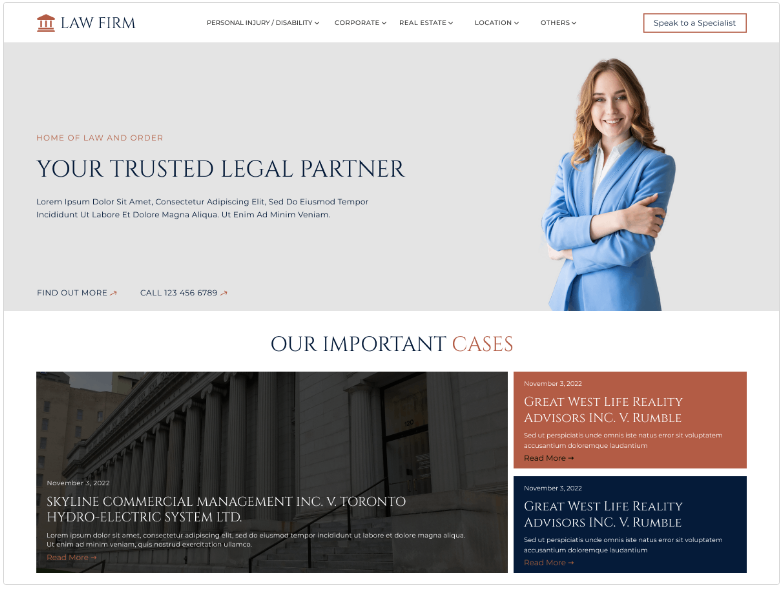
The production phase followed. We chose to begin with an existing WordPress theme and looked for a template that could be adapted to a legal consulting service. The options included FSE Lawyer Firm, SKT Insurance, Business Solutions, Immigration Consulting, and Law Firm Lite. We selected FSE Lawyer Firm as the primary foundation because its structure was well suited to an expert-led project built around trust, forms, clear information architecture, and future page development.
FSE Lawyer Firm, selected as the starting WordPress theme for “Repatriant”
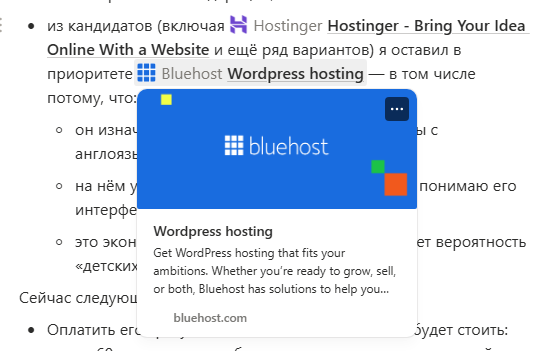
Hosting required a separate decision. The project needed reliable performance in the United States, Canada, and Europe, solid WordPress support, a clear interface, and minimal technical risk at launch. Bluehost became the preferred option: it is built around WordPress projects, works well for English-speaking markets, and was already familiar to us from our own infrastructure.
Selecting Bluehost for a WordPress website targeting English-speaking markets
As development progressed, it became clear that manually adapting the theme through sequential CSS, PHP, JavaScript, and template edits would be too slow and fragile. We restructured the development workflow itself and introduced Codex as a production tool. This allowed us to make changes across the theme’s key files more quickly, work through the website structure with greater precision, and reduce the risk of accidentally breaking completed components.
The website became the first major hub of execution. Brand presentation, the funnel, future analytics, advertising channels, and user trust all passed through it. At this stage, we were choosing the platform while assembling the foundation for Meta, Google Ads, GA4 events, and the entire lead generation system.
2. The First Advertising Route: Meta Lead Forms and the US Auction
While the website was under construction, we moved the first advertising route into Meta Lead Forms. This allowed us to begin testing demand inside Facebook and Instagram: a person could see the ad, open the form, and leave their contact details without visiting an external website.
This was important at the early stage. We needed the first market signals: whether the offer generated a response, which audiences produced impressions and clicks, how expensive entry into the selected geographies would be, and whether the limited budget could generate enough data for the next step.
The United States was the first test market. We deliberately began with the most expensive and competitive auction because the US was one of the project’s core geographies. A nationwide launch would have been too broad for the available budget, dispersing the test into noise and producing a weak basis for comparison.
We therefore divided the US into two hypothesis groups. The first contained states and territories with large Russian-speaking communities: Alaska, Washington, the District of Columbia, Massachusetts, New Jersey, New York, and Oregon. The second contained high-income states: California, Connecticut, Maryland, and Virginia. The first group tested proximity to a Russian-speaking community; the second tested potential purchasing power.
The first US A/B test in Meta: diaspora states and high-income states
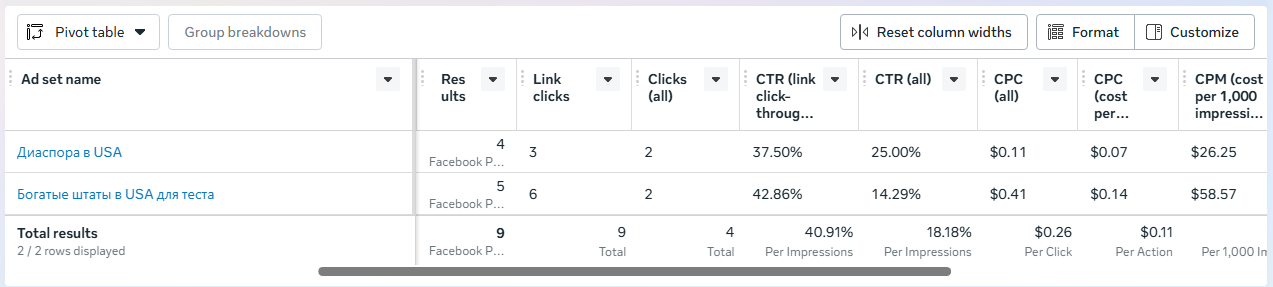
This launch was diagnostic. Its purpose was to determine whether the selected segments were reachable in the Meta auction, whether they generated impressions and clicks, and whether the minimum budget could support a geographic comparison.
The campaigns launched correctly and began receiving impressions and clicks. The limitation appeared quickly: a budget of $4 per ad set did not generate enough data for a valid segment comparison. We lost part of the auctions.
The first US launch confirmed that the ads could be delivered and established the need for a larger data volume before comparing audiences.
The first US Meta Lead Forms launch: impressions and clicks on a minimal budget
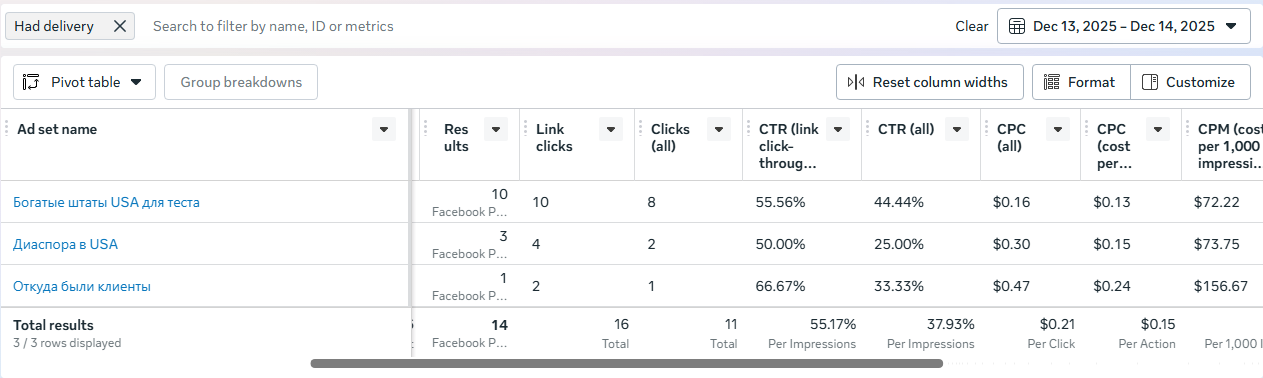
At this volume, it was too early to judge audience strength or hypothesis viability. The key finding was that our entry into the US auction was too thin: a sound comparison required more delivery.
The next decision was a follow-up test using the same campaign parameters while raising the budget from 4 * * to * *8 per ad set. This was intended to increase impressions, make the ads more competitive in the auction, and collect enough data to inform the next budget allocation.
The first Meta route immediately revealed the nature of the project: each hypothesis exposed a constraint, and each constraint informed the next adjustment. Continued work in the important US market required a more carefully calibrated auction entry and a larger body of data.
3. Geographic Pivot: United States → Germany / Europe
The first entry into the US auction gave us a baseline observation. Delivery worked, impressions and clicks appeared, and there were no severe signs of saturation or blocked delivery. The volume remained too small to calculate the economics or make a confident market forecast.
Within the test, Meta identified “High-income US states” as the stronger segment by cost per result. This was expected in a short launch: a broader audience generally gives the algorithm more room to deliver and produces an initial signal faster. Narrower concept-driven audiences, such as the diaspora states, require a longer evaluation horizon and more delivery.
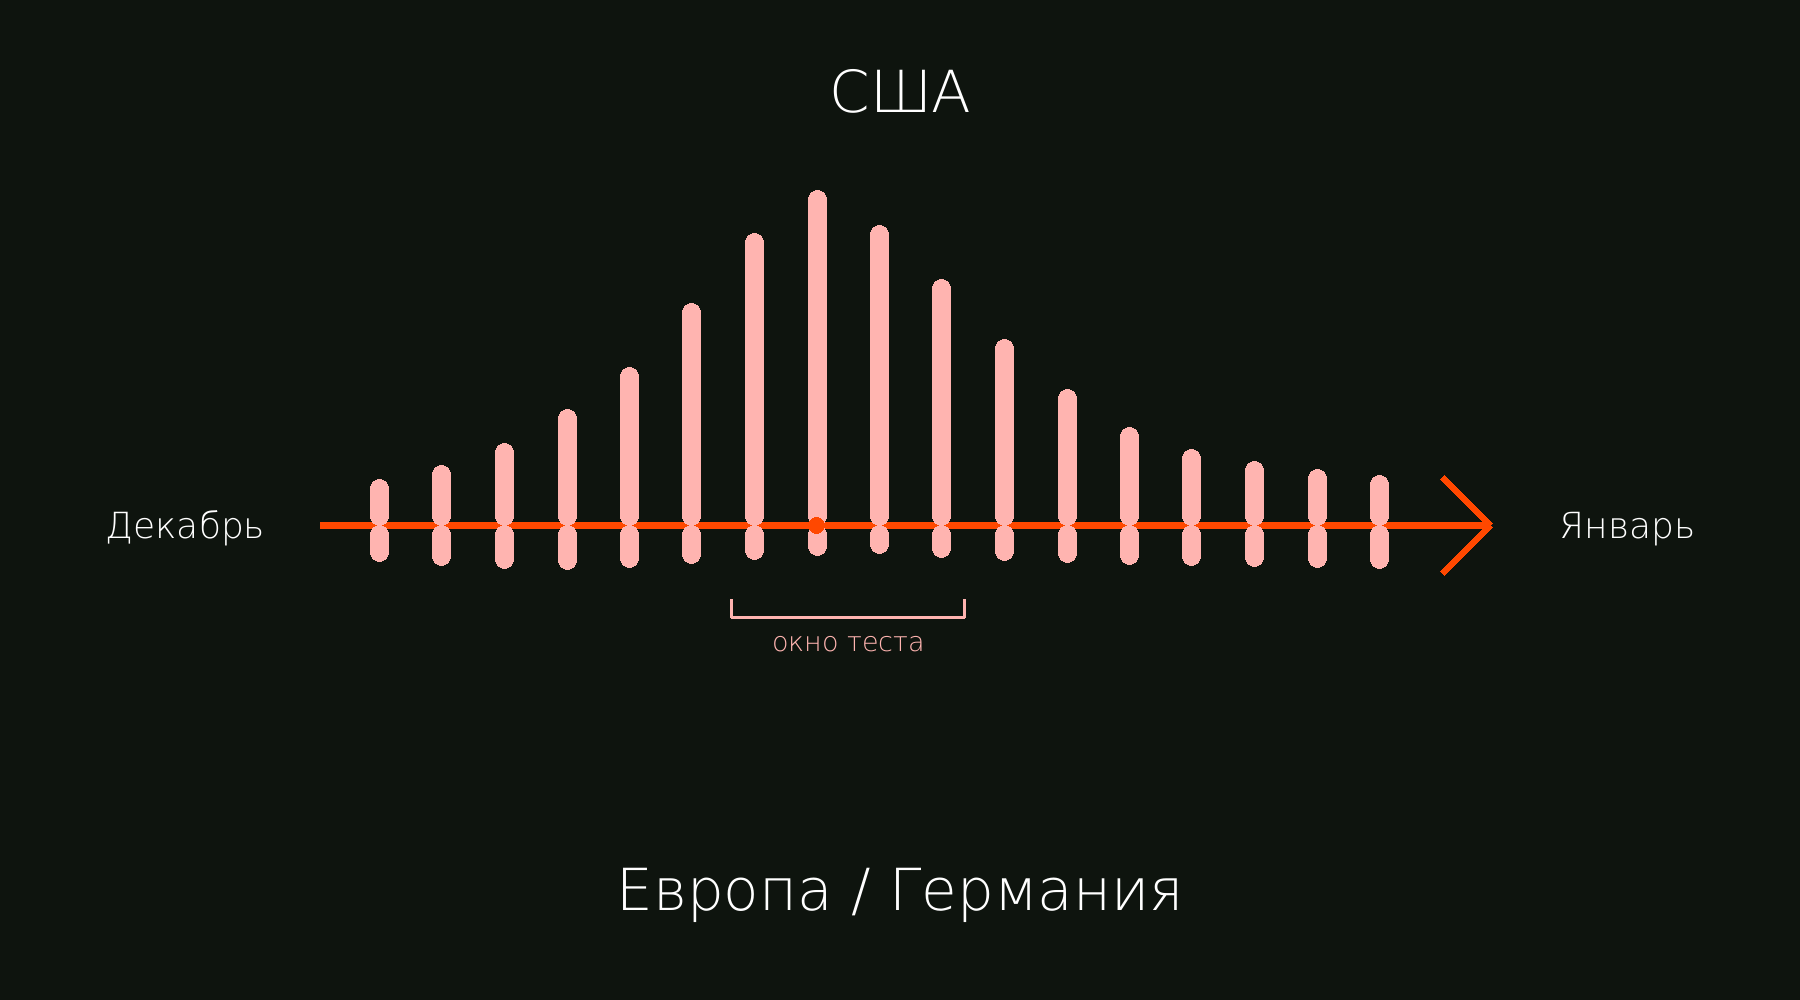
We then revised the geographic logic of the next tests. The United States remained one of the project’s key markets. In December, the US auction was also the hardest environment for careful exploration: large ecommerce budgets, Black Friday and Cyber Monday activity, the closing of annual advertising budgets, and intense competition for attention.
Europe offered a more even environment for the next step. Seasonal pressure was distributed more calmly, and auction dynamics depended more heavily on the vertical and the specific service. Germany therefore became the market in which we could accumulate audience responses, signals, and observations.
Germany offered several advantages as a test geography. Ecommerce pressure was already easing in the second half of December, and 24–26 December brought less competition for impressions during the holiday pause. The 27–30 December window appeared suitable for a controlled entry: year-end consumer activity was declining, January sales had not yet begun, and service and business audiences were gradually returning to their working rhythm.
Seasonal pressure in the Meta auction across December and January: the US above the timeline, Europe and Germany below
The pivot had a practical purpose: collect more behavioral signals in a more manageable environment, then use the patterns to inform further work in the United States. If audience, creative, and messaging combinations worked in Germany, we could adapt them for the US market with less uncertainty.
We kept the next German test methodologically clean. The ad copy remained unchanged so that a messaging change would not interfere with the interpretation. Every audience used the interest “Russia.” This held the conceptual frame constant while we observed how behavior changed across geographies and audiences.
The geographic pivot reduced early-stage uncertainty. The project needed enough consistent responses to reveal audience behavior and prepare a better-informed return to the expensive US auction.
4. First Leads and the Lead-Processing Setup
After the geographic pivot, the German test continued without abrupt budget changes. We deliberately held back the more specific audience segments at this stage. The first task was to test the Lead Forms format itself: whether it could generate contacts in the project’s current condition, how Meta would distribute impressions across broad audiences, and what the initial CPL would be.
We launched two broad audiences with the interest “Russia.” This gave the algorithm more room to find a response and allowed us to assess the format’s basic viability. Segmentation by family context, age, business interests, and other logics was reserved for the next layer of tests.
The Lead Forms campaign spent 33.53 * *,generated * * 7submissions * *,andproducedanaverageCPLof * *4.79.
First German Lead Forms results: 7 submissions at an average CPL of $4.79
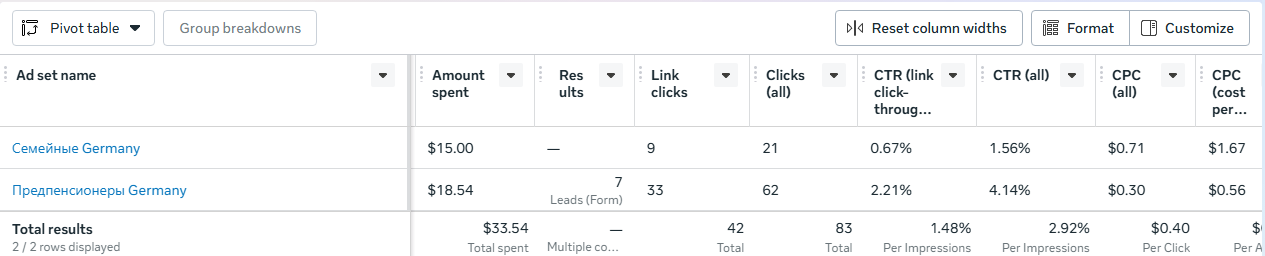
These figures became the first practical signal: the project began receiving inquiries before the website was fully ready. The leads immediately required a separate assessment. The submissions suggested that approximately two contacts might be irrelevant, so we recommended contacting everyone and collecting initial feedback: inquiry quality, recurring language, and signs of genuine intent.
At this point, qualification became part of the lead generation system. Each contact opened the next layer of work: response time, quality tracking, data transfer, and the accumulation of target-lead indicators. The advertising platform recorded a form submission. The business needed to understand the probability that it would progress to a consultation and a signed contract.
Lead processing required its own solution. We first considered integrating Meta Lead Forms with Bitrix24, which would have accelerated lead handling. After reviewing the risks, we proposed postponing the direct integration. Given sanctions-related constraints and the lack of a reliably documented operating pattern for this connection, avoiding unnecessary changes to the advertising infrastructure was the safer course.
As an interim solution, we proposed exporting Facebook Lead Forms submissions to Google Sheets and sending an email notification for every new submission. This was sufficient for the early stage: lead manager Anastasia could see incoming inquiries, contact people promptly, qualify them, and record the outcome.
The next planned step moved from testing the format itself to testing specific audience combinations. These included audiences connected to Russia through family scenarios, pre-retirement age and health topics, travel to Russia, and business interests, along with an Advantage+ test of Meta’s independent optimization.
5. From Website Draft to MVP
This case study shows the version of repatriant-consult.com that we built between 24 November 2025 and 23 January 2026. After our engagement ended, the project team changed the website’s design and structure. The current version differs from the screens below and is outside the scope of this case study.
By 19 December, the website existed as a working draft. Its structure, first sections, visual direction, and future conversion points were already visible. The task then shifted toward MVP readiness: defining the minimum set of components required to send traffic to the website and continue improving it from data.
At this stage, the work focused on turning the website into a functional point in the funnel. It needed to explain the service, lead a visitor toward a consultation, work correctly on desktop and mobile, accept inquiries, send them to the working spreadsheet, and meet the advertising platforms’ basic legal requirements.
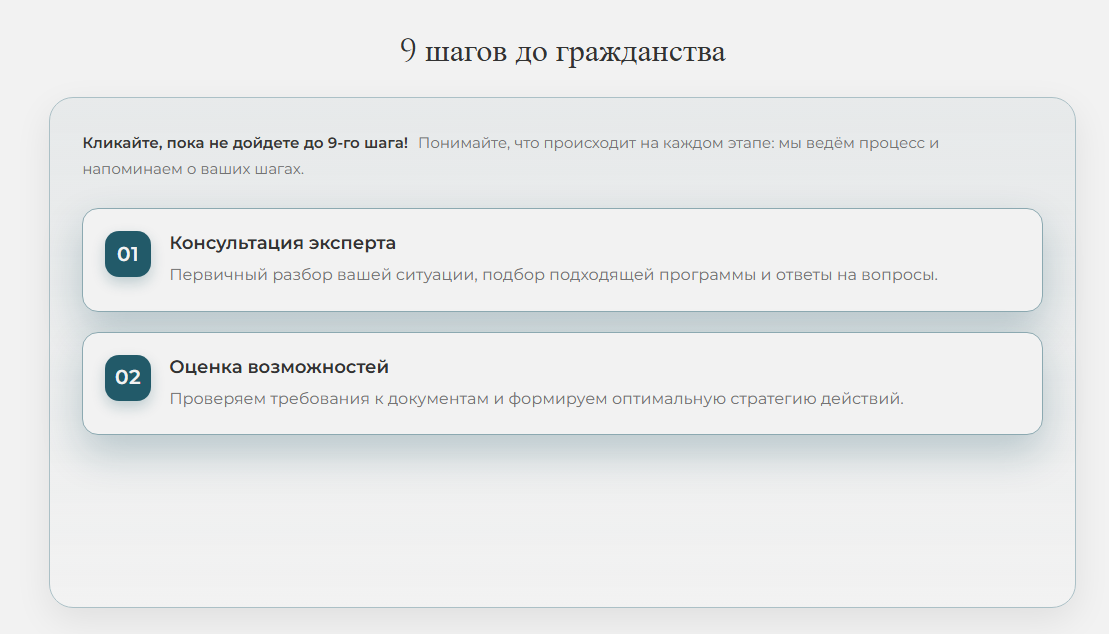
“9 Steps to Citizenship” website section: the route from consultation to outcome
The header became one of the first technical issues. During development, we discovered that it had disappeared because the theme name expected by the templates did not match the actual theme folder name on the server. The website could no longer locate the required template part, so the header stopped rendering. We restored the dependency chain and returned the header to working order.
We then examined the hero section and its slideshow. We needed to locate the slide markup, understand how background images were loaded, identify the styles controlling display, and establish a safe way to change visual elements. The hero was essential for advertising traffic: it needed to tell people quickly where they had arrived and what problem the service could help them solve.
We prepared separate assets for different devices. Desktop used a horizontal frame and background; mobile used a square version. We also adjusted text colors so the hero remained readable over the images. This was part of the conversion logic: visitors needed to understand the offer without effort and move to the next action.
Desktop hero for the “Repatriant” website, showing the step-by-step route

Mobile hero for the “Repatriant” website, with an adapted frame and CTA

The expert profile was the next layer. Trust in the legal and immigration niche is closely tied to a specific person, so the section needed concrete detail. We replaced the photograph and adapted the content for Galina, giving the website a recognizable expert at its center.
Website expert section: Galina Kuznetsova as the person behind the expertise

The inquiry form was developed in parallel using Forminator. We connected the form to Google Sheets so submissions would enter a shared table and could be processed without repeatedly moving data by hand. This continued the early-stage logic: collect inquiries reliably, view them in one place, and postpone a premature CRM integration.
Website contact section: Russia, the United States, Telegram, WhatsApp, and Facebook
By 25 December, the website was assessed as approximately 90% ready to receive traffic. This meant the core MVP was in place: page structure, hero, expert section, forms, basic lead-transfer logic, and the technical foundation for advertising.
We also built a separate English-language legal and compliance layer. For advertising platforms and banking compliance, we prepared an English home page, Company Information, Terms of Service, and a US Privacy Policy. These pages were accessible from the footer. The form field labels and consent copy were also prepared in English so visitors would understand what data they were submitting and which documents they were accepting.
Website footer with legal links: Privacy Policy, Terms of Service, and Company Information
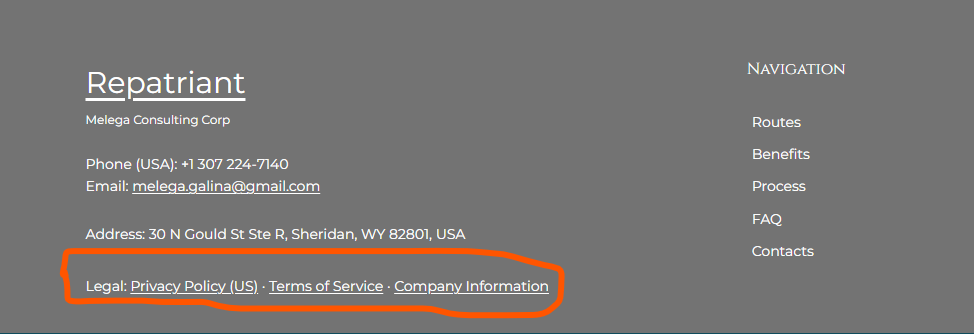
The website had now moved from an early build to a functional MVP point in the funnel. It could receive traffic, explain the service, collect inquiries, and meet the advertising infrastructure’s basic requirements. Future development was meant to follow traffic data: which sections people read, how far they progressed toward the form, which questions arose, and which elements obstructed conversion.
6. The First Working Meta Combinations
The next German launch showed why form-submission cost must be assessed alongside inquiry quality. From 23 to 28 December, Meta spent $128.46, generated 347 clicks of all types at $0.37, and produced 14 submissions at an average cost of $9.17. Traffic was substantially cheaper than the lowest scenario in our unit model. Contact processing revealed low quality in part of the flow: many people did not respond, and some inquiries appeared accidental.
We rebuilt the Lead Form’s structure and questions, selected the correct version, and restricted submissions to users who had first viewed the ad. The form gained a small additional threshold that required more deliberate intent before a person shared their contact details.
Across 27–28 December, the updated combination spent $48.11, generated 74 link clicks at $0.65, and produced 5 submissions at an average cost of $9.62. Two of the five leads qualified, and one person was handed over for further support.
Results from the 27–28 December launch after the Lead Form update.
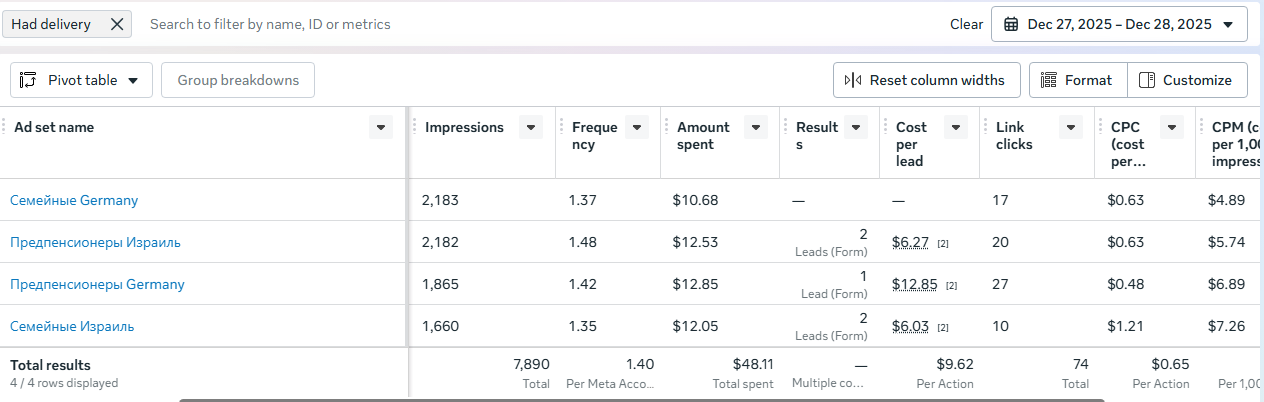
CPL remained almost unchanged, and lead generation reached a concrete outcome in the business process for the first time.
An anonymized excerpt from the lead-processing table. Comments recorded inquiry quality and whether each lead was accepted for further work.
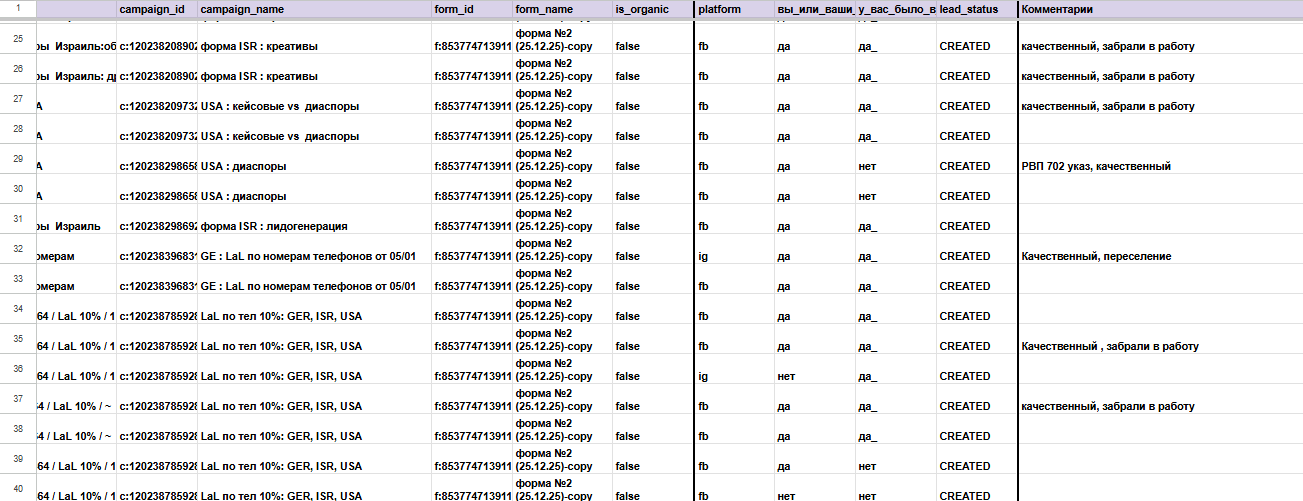
From this point onward, the entire combination became the unit of testing: geography, audience, creative, form version, and processing outcome. Submission count remained one signal among several. Advertising decisions were now informed by qualified inquiries and the person’s subsequent movement through the funnel.
After holiday pressure eased, we returned to the United States. CPM fell from approximately $80 to $25, making the market suitable for another controlled test. The campaign targeting states with the largest Russian-speaking communities produced 2 inquiries at an average cost of approximately $13. We retained the one audience that had already generated a result; further splitting a small budget would have produced samples too short to interpret.
In parallel, we returned to the Israeli audience aged 45–64. This segment had previously generated the largest number of submissions and qualified leads. The next task was to identify which component produced the result: the audience, ad format, copy, or a specific creative.
We compared three variants within a single audience. The control was a static creative that had already generated inquiries. The second variant adapted it for Reels. The third used the narrative logic of our legal case studies: the person’s situation, a sequence of support, and a clear working route.
The control creative generated 4 inquiries at $6.14. The new narrative produced 2 inquiries at 13.54 * * .Reelsspent * *20.19 and generated no inquiries. The control remained the working creative for maintaining lead flow through 5 January. We retained the other two directions for future iterations.
Creative test in Israel: the control, a new narrative, Reels, and adjacent combinations.
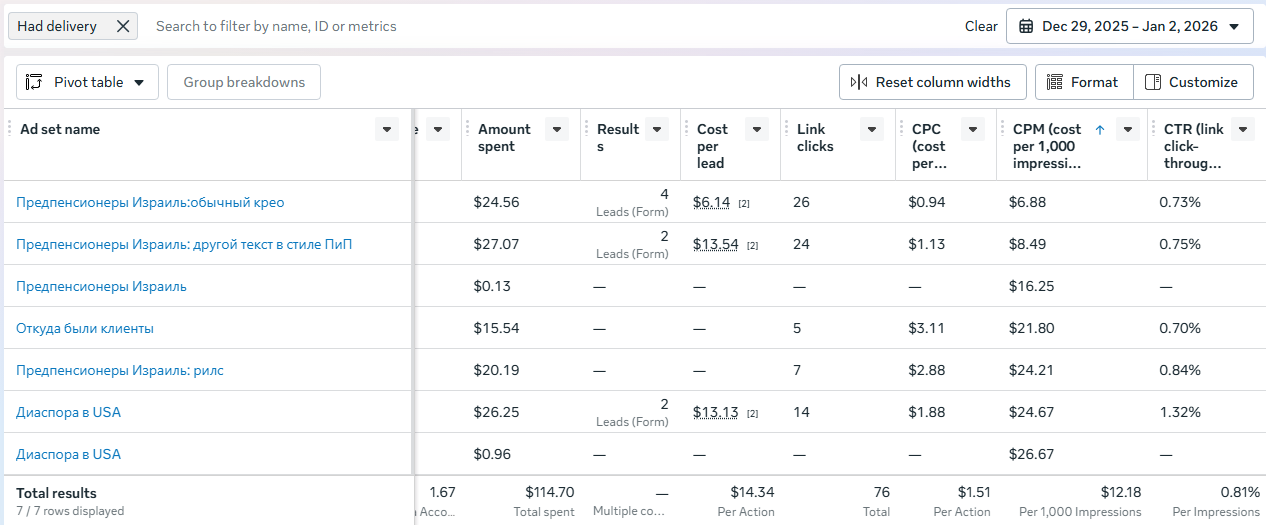
From 29 December through 2 January, this stage spent $113.54. Meta generated 8 submissions at an average cost of $14.19. The aggregate figure now contained distinct roles for each combination: Israel generated the main volume, the US diaspora geography began producing inquiries again after auction costs fell, and the control creative became the benchmark for new approaches.
In the supporting run from 2 to 5 January, Israel received 19.93 * * andgeneratedoneinquiry.TheUSdiasporacampaignspent * *16.50, generated 2 inquiries at $8.25, and produced one qualified lead. The short Israeli sample declined in quality. Earlier accumulated data still showed the most stable volume from this audience. The US result warranted a separate test of whether qualified inquiries could be reproduced.
Both combinations were extended from 6 to 12 January without increasing daily spend. A longer run was intended to show whether the result would repeat over a calmer period. Advantage+ and Lookalike were separated into their own tests so that algorithmic audiences would not mix the baseline campaign data.
By early January, Meta had produced its first working configuration: an improved Lead Form, the Israeli control creative, a US diaspora audience, qualification feedback, and separate branches for new formats. The project now had a set of combinations that could be tested for stability and developed further.
7. Analytics Before Google Ads
By the time we moved toward Google Ads, the website already worked as an MVP: it explained the service, accepted inquiries, and sent them to the working table. Search traffic required a fully instrumented user journey. Recording only a visit and a form submission left every lost lead equally opaque. A person could leave from the hero, skip an important section, read the FAQ, click a CTA, or stop at the form; the final number would show zero in every case.
We therefore paused the Google Ads launch briefly and instrumented the user journey first. We needed an event sequence from which a funnel could be built: the person arrived on the page, viewed the relevant section, interacted with it, clicked a call to action, reached the form, and submitted an inquiry.
We connected Google Analytics 4 through Google Tag Manager. The system had two layers. A tracker on the website recorded actions in the dataLayer, a single event log. GTM tags collected those events and passed them to GA4 in a standardized way. This structure made errors easier to diagnose and allowed new events to be added as the page evolved.
GTM tags: the dataLayer tracker, base GA4 tag, and event transmission.
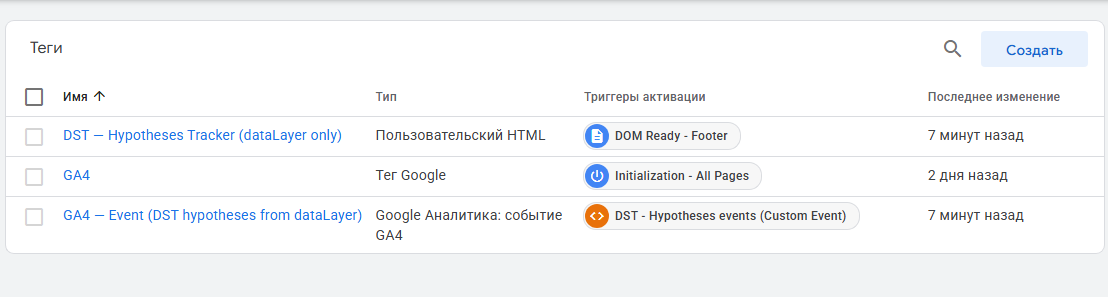
The instrumentation followed the theme’s actual architecture and specific website elements. Analytics captured section views, interactions with routes and content blocks, CTA clicks, and form submissions. These data could be used in Funnel Exploration and Path Exploration, connecting on-page behavior with the ad and search query that brought the person there.
We validated the events in DebugView and the GA4 Realtime report. Form submission was marked as a key conversion. The inquiries themselves continued to enter the working table. We then created and linked Google Ads to Google Analytics so that advertising data and website behavior would enter the same system after launch.
Website events in the GA4 Realtime report.
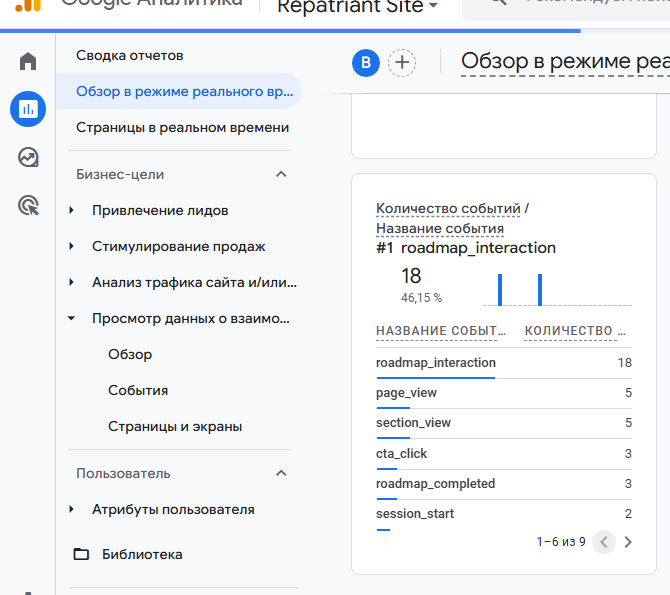
One final connection remained before launch: linking GTM to the consent banner so that tags would load according to the user’s consent and European regulatory requirements. Search traffic could then enter a measurable funnel.
The resulting analytics explained each route a user could take through the page, including journeys that did not end in an inquiry. The first Google Ads data would show the cost of each result, query quality, and the exact point where users dropped out.
8. Google Ads as a Diagnostic Channel
We launched the Search campaign on 13 January 2026. Search was the first format because it reveals the language people actually use, allows close control over traffic intent, and makes irrelevant directions easier to exclude. For a project still accumulating data, search-traffic transparency was the priority.
Performance Max remained outside the initial test. The automated format requires stable conversion signals. Analytics and consent mechanics were only becoming operational, so an early launch could have mixed traffic sources and left the algorithm with too little reliable learning data.
Search campaign launch on 13 January and the working daily budget.
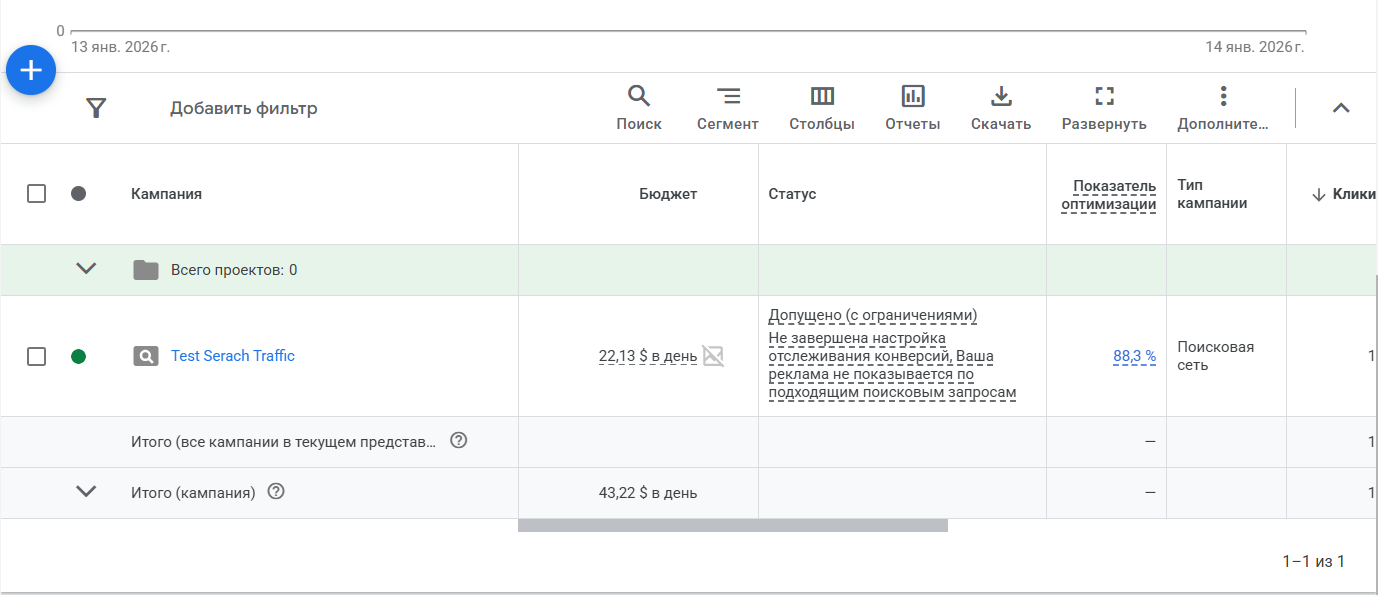
We divided keywords by level of intent. The first cluster included searches in which people had already formulated an action: returning to Russia, repatriation, and restoring or obtaining citizenship. This demand was closer to a decision and an inquiry.
The second cluster covered the Awareness stage: broader searches around Russia, homeland, and the possibility of returning. It tested a separate hypothesis—whether top-of-funnel demand could progress toward a consultation and what that progression would cost.
Initial queries in the diagnostic launch: direct intent and the broader theme of returning.
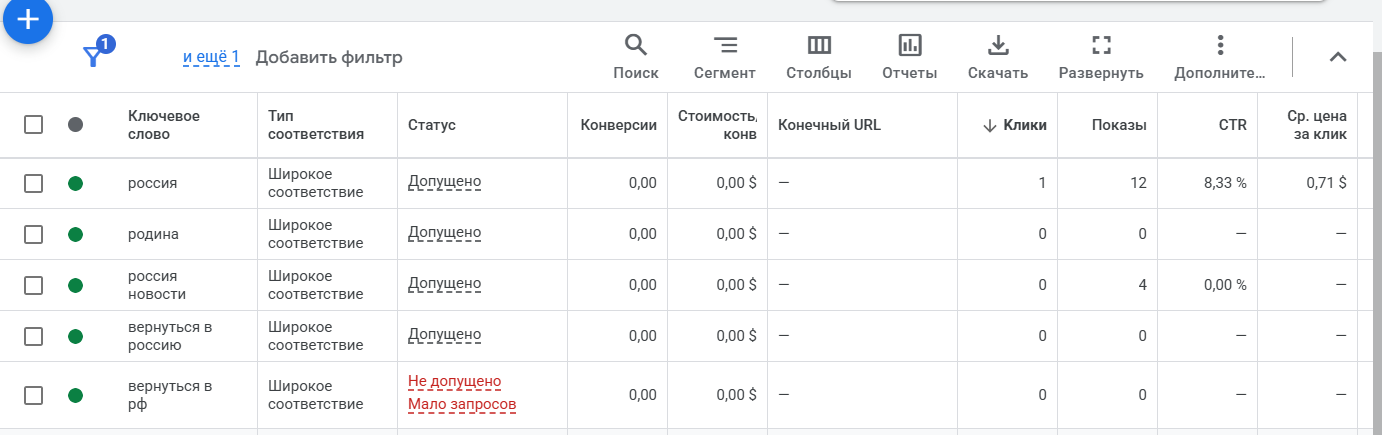
Broad keywords carried a clear risk: ads could attract people looking for news, tourism, reference information, or geopolitics alongside potential clients. We managed this risk through the ad copy, a specific offer of legal consulting support, and ongoing review of actual search terms. Irrelevant queries could be excluded as the data accumulated.
The search auction immediately revealed another constraint. Google estimated a working level of approximately $22 per day for each campaign. At a substantially lower budget, the campaign lost auctions, received few impressions, and could not accumulate enough data for a conclusion. Spend was controlled by separating clusters, managing priorities, and reallocating budget sequentially as the first signals appeared.
We treated the opening days of Google Ads as a diagnostic stage. We needed to see which phrases actually brought people in, how much auction participation cost, how users moved through the instrumented page, and whether events were recorded correctly. Those answers would prepare the next stage: expanded keyword coverage and more automated formats.
9. The End of the Working Stage: Meta + Google + Website + Data
By mid-January, work was moving through two advertising systems in parallel. Meta was already generating inquiries and allowing us to compare their quality. Google remained a diagnostic channel in which we needed to establish a viable way to participate in the auction and gradually move the algorithm closer to a business conversion.
The first Search launch, from 13 to 15 January, barely entered the auction. The campaign spent $0.71, received 70 impressions, and generated 1 click. This volume could not support an assessment of queries, ads, or demand, so we stopped the campaign and rebuilt its architecture.
From 16 to 18 January, Google moved to a multi-campaign setup with one intermediate conversion: a website visit lasting at least one minute. The focus remained on the United States and people aged 30–64. For $30.39, the system generated approximately 30,044 impressions, 2,316 clicks at $0.01, and 539 one-minute visits at an average cost of approximately $0.056. The launch produced no direct inquiries.
Results of the Google Ads multi-campaign launch, 16–18 January.
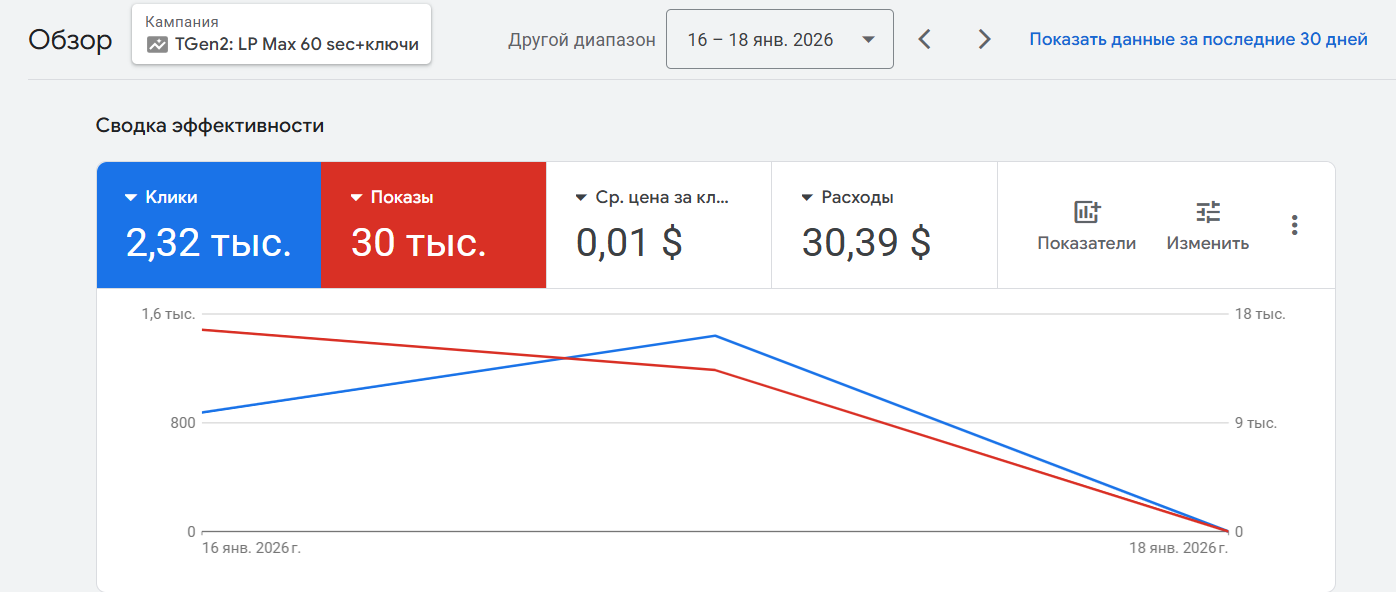
The inexpensive volume showed that the algorithm could find people who remained on the page. A one-minute visit was still too weak as a business signal. The next cycle needed a deeper action: viewing the expert section, clicking a CTA, or another event connected to meaningful consideration of the service.
By 21 January, we had added a CTA after the final step of the website road map. The button appeared once a visitor completed the route and directed them toward the inquiry form. We prepared it for desktop, mobile, and the English version, and instrumented the click as a separate event. This action provided a deeper interest signal and could become the next key conversion for Google Ads.
CTA shown after the complete website route.

From 16 to 18 January, we tested a 10% Lookalike in Meta. The broader similarity range was intended to give the algorithm more volume and slow the exhaustion of a narrow audience. At a spend of $53.69, the campaign generated 9 inquiries at 5.96 * * .Twoqualified, producingacostperqualifiedleadof * *26.84.
The source audience limitation appeared at the same time. Even across this short period, average frequency approached 1.3–1.5 impressions per person. Further scaling required combining the client database with all Meta Lead Forms submissions and regularly refreshing the seed after each new launch.
From 20 to 22 January, we continued without substantial changes inside the ad set, preserving accumulated signals across Meta’s seven-day learning window. Another $39.74 produced 4 inquiries at $9.93, two of which qualified. The short repeat launch again produced viable inquiries. The data volume remained small.
Final Meta launch, 20–22 January: four inquiries across three geographic groups.

By the time work stopped on 23 January, the project consisted of connected parts. The website collected inquiries and recorded the user journey. Meta generated qualified inquiries and data for updating the Lookalike audience. Google showed the cost of traffic and intermediate interactions. Lead-quality feedback returned to advertising decisions through the working table.
The next stage was clearly defined: refresh Meta’s source audience, test a deeper Google conversion, continue improving the website from behavioral data, and accumulate enough evidence to establish a stable cost range for qualified leads. Scaling and validating the funnel through the target number of signed contracts remained outside the completed two-month stage.
After the active engagement ended, the form we had built continued to work. While it remained on the previous website, new inquiries occasionally entered the table. The screenshot shows an anonymized entry added on 6 March 2026, more than a month after the work stopped.
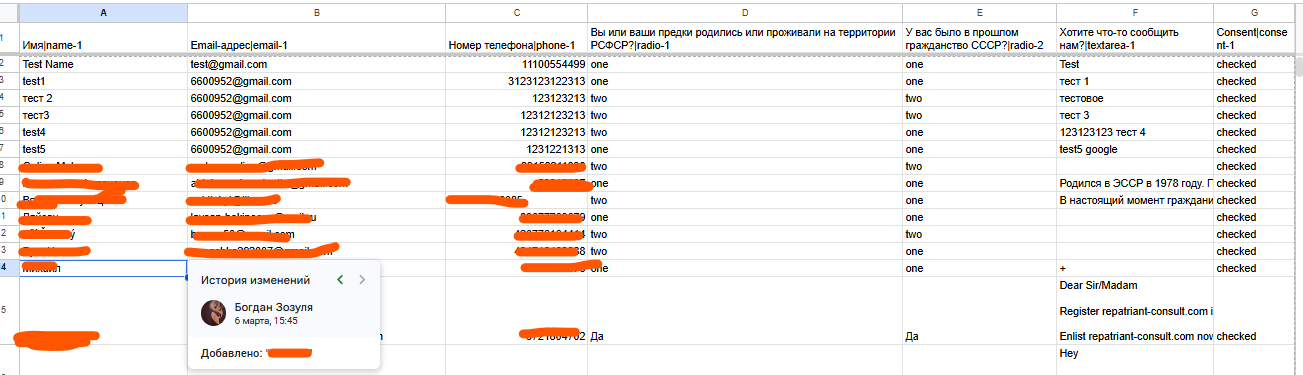
The entry history lists Bogdan Zozulya as the author because the Forminator–Google Sheets integration was authorized through his Google account. The form added the inquiry automatically through that connection.
Results
During the engagement, “Repatriant” moved from an expert service, a name, rough calculations, and an AI-generated image to a connected system for acquiring and processing demand. By 23 January, the project had a bilingual WordPress website for desktop and mobile, a visual system, forms and a working lead table, legal and compliance pages, Meta and Google advertising infrastructure, GA4, GTM, and a dataLayer mapping the user journey.
The hosting account belonged to the client. The repository, codebase, analytics, forms, accumulated data, and access credentials remained with her. The completed system was transferable and allowed another team to continue the project.
Reaching the target of 80 qualified leads and 8–12+ signed contracts required additional time, budget, and another series of tests. The completed two-month stage confirmed demand, produced the first qualified inquiries, and established initial real-world cost benchmarks. Stability, scalability, and conversion into signed contracts remained objectives for the next stage.
What Meta Demonstrated
According to Ads Manager data for non-overlapping periods from 23 December to 22 January, advertising recorded 61 Lead Form results at a spend of 542.64 * * .Theaverageplatform − reportedCPLwasapproximately * *8.90.
The number 61 is the advertising platform’s submission count. Uniqueness and inquiry quality were assessed separately through Anastasia’s qualification work and comments in the working table.
Reports for the non-overlapping periods confirm at least 8 qualified leads. One early lead was passed into further support. Our evidence for that inquiry ends at the handoff into support; we have no data confirming a sale or signed contract.
Across the three launches for which both spend and client-side qualification outcomes were recorded, the cost per qualified lead was:
- $24.06 — 27–28 December;
- $26.84 — 16–18 January;
- $19.87 — 20–22 January.
This preliminary range became the first real-world benchmark derived from actual market behavior. A claim about scalability would require more stable statistics.
Individual combinations indicated where to move next. The static control creative in Israel generated 4 inquiries at $6.14. The 10% Lookalike launch on 16–18 January produced 9 inquiries at $5.96, two of which qualified. The final short launch generated another 4 inquiries, including two qualified leads.
What TQO’s Operating Method Demonstrated
Meta produced the proven lead generation outcome in this stage. Google Ads served a diagnostic role and generated no direct inquiries. The channel completed the first steps of a progressive learning strategy: the initial Search launch produced 1 click for $0.71; after the rebuild, the multi-campaign setup generated 2,316 clicks and 539 one-minute visits for $30.39; and the website then gained a deeper event, the CTA shown after the complete route.
The progressive learning strategy began producing its first usable signals: the algorithm accumulated data for an intermediate event, showed that the event had a weak relationship with inquiries, and prepared the transition to a signal closer to a business action. The next launch was meant to test interaction with the CTA and subsequent movement toward the form.
Every hypothesis moved through a working cycle. We first assessed it by Impact, Confidence, and Ease, then translated it into Action, collected Data, and turned the result into an Insight for the next test. In Meta, the low quality of the first submissions led to a more demanding form and a connection between advertising data and manual qualification. The 10% Lookalike produced inquiries and revealed the limit of the source audience, making a seed refresh the next action. In Google, the one-minute visit generated volume and established the need for a deeper conversion.
TQO turned a series of launches into a sequential learning system in which positive and negative results both produced data for the next decision. By the time the engagement stopped, the project could collect inquiries, explain where they came from, show a person’s route through the website, and feed quality assessments back into advertising decisions.
The completed form continued to work after the active stage ended. At least one new inquiry entered the working table automatically on 6 March 2026. This entry confirms the technical viability of the transferred asset; a single late inquiry cannot establish stable lead generation.
Failures and F*ups
In this chapter, f*ups are errors in test design, signal selection, and the sequence of work. The Reels test generated no inquiries, producing an interpretable negative result. A management failure begins when a result cannot be interpreted or the primary objective loses the runway required for a valid test.
We Underestimated How Little Existed at the Outset
The initial proposal projected a Google Ads launch within 16–24 days and a Google + Meta setup within 23–35 days. Those estimates were too optimistic.
At the outset, the project had no advertising campaigns, website, analytics, stable form, legal and compliance layer, functioning advertising infrastructure, or established lead-processing workflow. We also discovered a full advertising restriction on the client’s profile dating back to 2021. The website then grew from a fast landing page into a WordPress foundation for advertising, content, and SEO.
WordPress gave the project more room to grow. Our management error was failing to revise the timeline promptly once the true scope emerged. We should have separated the infrastructure-building phase from the advertising-economics phase immediately and made clear that a two-month horizon would almost certainly contain only the beginning of the second stage.
The First US Tests Were Too Thin for the Auction
We began in one of the most expensive geographies during a difficult season, allocating 4peradset * * andlaterincreasingitto * *8. The ads delivered. The data volume remained insufficient for a clean audience comparison. US CPM reached approximately 80 * * inDecemberandfelltoaround * *25 after the holidays.
The test produced a useful signal about the cost of entering the auction. The available volume was insufficient for a confident conclusion about the segments. A better design would have defined the minimum number of impressions, clicks, and spend required for an interpretable comparison, or begun exploration in a calmer geography.
Qualification Arrived After the First Working Launch
The first working German Lead Forms launch generated 7 submissions at $4.79. The advertising dashboard showed a low submission cost. Processing revealed the quality of the flow: a substantial share of people did not respond or did not fit the service.
We then made the form more demanding, added questions that required greater intent, and connected advertising data with manual lead assessment. Quality improved, with CPL staying close to its previous level. This logic should have been present in the first working form so that the project looked for people ready to discuss their own route home and legal support from the beginning.
Analytics Arrived Later Than It Should Have
We delayed Google Ads until the user journey had been instrumented through GA4, GTM, the dataLayer, CTA interactions, and form submission. The website needed to provide a more meaningful signal than a binary answer to whether an inquiry existed.
The analytics layer should have been built in parallel with the first working version of the website. Google Search launched only on 13 January, ten days before the engagement stopped. A channel with more expensive and slower-moving demand received too little runway.
Google Optimized for a Goal Too Far from Revenue
The first Search launch barely entered the auction: $0.71 in spend, 70 impressions, and one click. After rebuilding the setup, we gave Google an intermediate conversion—a website visit lasting at least one minute.
The algorithm found inexpensive volume: 2,316 clicks and 539 one-minute visits for $30.39. No inquiries followed. A one-minute visit had too little connection to inquiry intent: the system optimized for time on page without a strong enough relationship to the next business step.
We prepared a deeper goal—the CTA shown after the complete route—only by 21 January. In a future build, this action should exist before the multi-campaign launch and receive more time for validation.
Some Hypotheses Did Not Work
These tests produced interpretable negative results:
- Reels spent $20.19 and generated no inquiries.
- The new legal-case-study narrative generated 2 inquiries at $13.54; the control creative generated 4 at $6.14.
- Advantage+ spent $17.87 without generating an inquiry.
- Short repeat launches of the Israeli and US combinations that had previously generated inquiries did not reproduce the result.
Every working combination needs a separate reproducibility test: audiences change, auctions change, and frequency rises.
The Lookalike Quickly Reached the Source Audience’s Limit
The 10% Lookalike generated 9 inquiries, two of which qualified. In a short period, frequency approached 1.3–1.5 impressions per person, exposing the small source audience available for sustained scaling.
The next step was to combine the client database with all genuine Meta Lead Forms submissions, refresh the seed regularly, and retest the Lookalike. We did not complete this cycle before the engagement ended. We also lacked enough anonymized client stories in the website and advertising to strengthen trust in a complex legal and immigration niche.
We Did Not Reach the Primary Proof
The stage’s central failure was the absence of a validated funnel from advertising spend to a signed contract. We therefore cannot calculate CAC or ROMI honestly, or validate the client’s preliminary model of 80 qualified leads and 8–12+ signed contracts. We established demand, working combinations, the first qualified inquiries, and infrastructure for another cycle. The core revenue loop remained open.
If we rebuilt the project, we would recalculate the critical path earlier, connect volume with qualification from the first form, deploy analytics alongside the website, and give Google more time with an event closer to the inquiry. Negative hypotheses would remain part of the work. The core economics would receive a longer validation runway.
Conclusions
The case study ends after the market has become visible, paid entry has proven possible, and the preliminary model has received its first real-world corrections.
Demand for returning to Russia among people living abroad was confirmed through ad responses, form submissions, and qualified inquiries. Working signals appeared in Israel, Germany, the United Kingdom, and the United States. Whether this demand could convert consistently into 8–12+ signed contracts at acceptable economics remained a question for the next stage.
The Unit Model Needed a Qualification Layer
The client’s preliminary model distinguished between an initial inquiry, a qualified lead, and a signed contract. Our initial unit model tracked a lead and a client. The live launches showed that a separate qualification layer is essential between a form submission and a sale.
At the top level, Meta’s average platform-reported CPL was approximately 8.90 * * .Theoptimisticunit − modelscenarioassumedaCPLof * *10.71.
Across the three fully calculated periods, a qualified lead cost 19.87–26.84 * * .Ifthisearlyrangeheld, 80qualifiedleadswouldrequireapproximately * *1,590–2,147 in advertising spend within the cost range already identified. Under the same simplified conditions, the original $1,251 would produce an estimated 47–63 qualified leads.
The full budget required to reach the target volume would be higher. It would include the work required to identify the cost range itself, negative and repeat tests, algorithm learning, new creatives, seasonal and geographic variation, the team’s fee, and other project expenses. The upper figure of $2,147 is therefore an advertising-spend benchmark based on the first market data. The completed stage does not support an exact total-budget calculation.
This is the model’s first correction based on a live market. It shows that the preliminary calculations underestimated the learning runway between the first launch and a stable funnel through signed contracts.
The Working System Remained with the Client
The system derived its value from the signals moving between the website, Meta, Google, GA4, GTM, Lead Forms, and the working table.
Advertising generated inquiries. Anastasia qualified them and recorded the processing outcome in the table. Those data changed the form questions, audience choices, and Lookalike structure. Website behavior changed analytics events and the next Google conversion. The website became part of the lead generation production system, and the work developed into a sequential system in which every action leaves data for the next one.
The hosting account belonged to the client, the repository and codebase remained accessible to her, and the accumulated data and working assets could be transferred to another team. TQO built the infrastructure inside the client’s own digital environment, so the end of our stage still left the project able to continue from an established foundation.
How Far You Can Go with TQO
At the outset, “Repatriant” had almost nothing but a steering wheel: an expert service, a name, rough calculations, and an AI-generated image. In two months, TQO assembled a working vehicle around it—a website, hosting, a visual system, advertising, analytics, lead qualification, and a hypothesis system—put it on the road, and collected the first market data.
A client can come to us with almost no marketing infrastructure. To begin, we need product expertise, access to the business context, and a willingness to test the economics. TQO can assemble the remaining components, connect them into a client-owned system, and organize progressive funnel learning.
Validating the route from advertising spend to signed contracts requires a realistic runway and a separate testing budget. In “Repatriant,” that work remained the next cycle. The proven part of the case shows how far a business can travel with TQO even when the project begins with little more than a steering wheel.
Reviews and Outlook
We did not receive a detailed review of the work or the business result from the client. Her final message on 22 January read:
“Friends, thank you for your work. At this stage, we’re pausing the engagement. Please transfer all access credentials.”

The message expresses gratitude for the completed stage and does not assess lead quality, the website, or return on investment. We preserve its original meaning and do not attribute additional conclusions to the client.
On 23 January, we confirmed the pause and began compiling all access credentials into a single handover list. TQO’s active work on the project ended at that point.
What Was Prepared for the Next Stage
By the time the engagement stopped, the project’s outlook had been translated from general intentions into concrete actions:
- combine the client database with accumulated Meta Lead Forms submissions and rebuild the Lookalike;
- retest the 10% Lookalike with a fresher seed;
- make the CTA shown after the complete route a key conversion and test it in Google Ads;
- continue improving the website from user-behavior data;
- add anonymized client stories and present the expertise more fully;
- connect the initial inquiry, qualification, call, and signed contract in one CAC-measurement system.
The list defined a ready next stage designed to answer the remaining question: whether the working combinations could reproduce their results for long enough to reach signed contracts.
What Happened After Our Engagement
After our stage ended, the project continued and the website was redesigned without TQO’s involvement. The current version of repatriant-consult.com therefore cannot be used as an illustration of our development work, and its design decisions cannot be attributed to our team.
The form we built remained on the previous website for a period and continued accepting inquiries. A confirmed entry from 6 March shows that the technical setup continued to work after the project was transferred.
One late inquiry is insufficient to establish stable lead generation, a channel, cost, or traffic quality. Its arrival confirms that the project retained a live working asset after our departure.
“Repatriant” continued along a different branch with different contractors. Our case study ends where our responsibility ends: with an assembled system, the first market data, and a transferred ability to continue from an established foundation.
Credits
The Quiet Orbit
- Bogdan Zozulya — TQO Director
- Polina Mladshikh — Growth Marketing Specialist
The “Repatriant” Team
- Galina Melega (Kuznetsova) — Client and Project Expert
- Anastasia — Lead Manager, lead qualification